Data
Data collection, processing, analysis, dashboards and databases that support practical business decisions.

DelacoTech turns disconnected operational data into information that teams can understand and use. Work can begin with spreadsheets and manual reports or with data already held across several applications and databases.
We define the question first, then establish the required sources, quality checks, transformations and reporting. The result can be a one-off analysis, a maintained data pipeline, a dashboard or a database-backed reporting system.
- Data collection
- Define the required fields, sources, ownership and controls for reliable data capture.
- Data processing
- Clean, validate, combine and transform data into consistent datasets for reporting or system use.
- Analysis
- Investigate performance, patterns and exceptions against clearly defined business questions.
- Dashboards
- Present useful measures and trends through role-appropriate reporting interfaces.
- Databases
- Design and improve data stores, queries, access controls, backups and integrations.
How the work runs
- 1
Questions
Agree the decisions the work must support and the measures required to make them.
- 2
Sources
Identify ownership, quality, gaps and access requirements across the available data.
- 3
Processing
Build documented validation, transformation and storage steps that can be repeated.
- 4
Reporting
Deliver analysis or dashboards with definitions, access and operating documentation.

Croft Group's farm platform, one morning
Sample data, modelled on the pipeline we built for Croft Group
- INFarm recordsInput
412 entries from 4 houses: eggs, feed, deaths
Waiting0.00 sec - ETClean and loadETL job
3 duplicates removed, 2 missing feed weights filled
Waiting0.00 sec - FCForecastModel
House 3 expected today: 3,450 eggs
Waiting0.00 sec - ADAnomaly checkRule
House 3 recorded 2,860, 17% under forecast
Waiting0.00 sec
OUTHouse 3, eggs per day
Alert to farm manager · 07:04
House 3 laid 2,860 eggs, 17% under forecast.
Feed intake in the same house fell two days in a row. Check water lines and bird health before the next collection.
Related work
- paa.scansanproperties.com
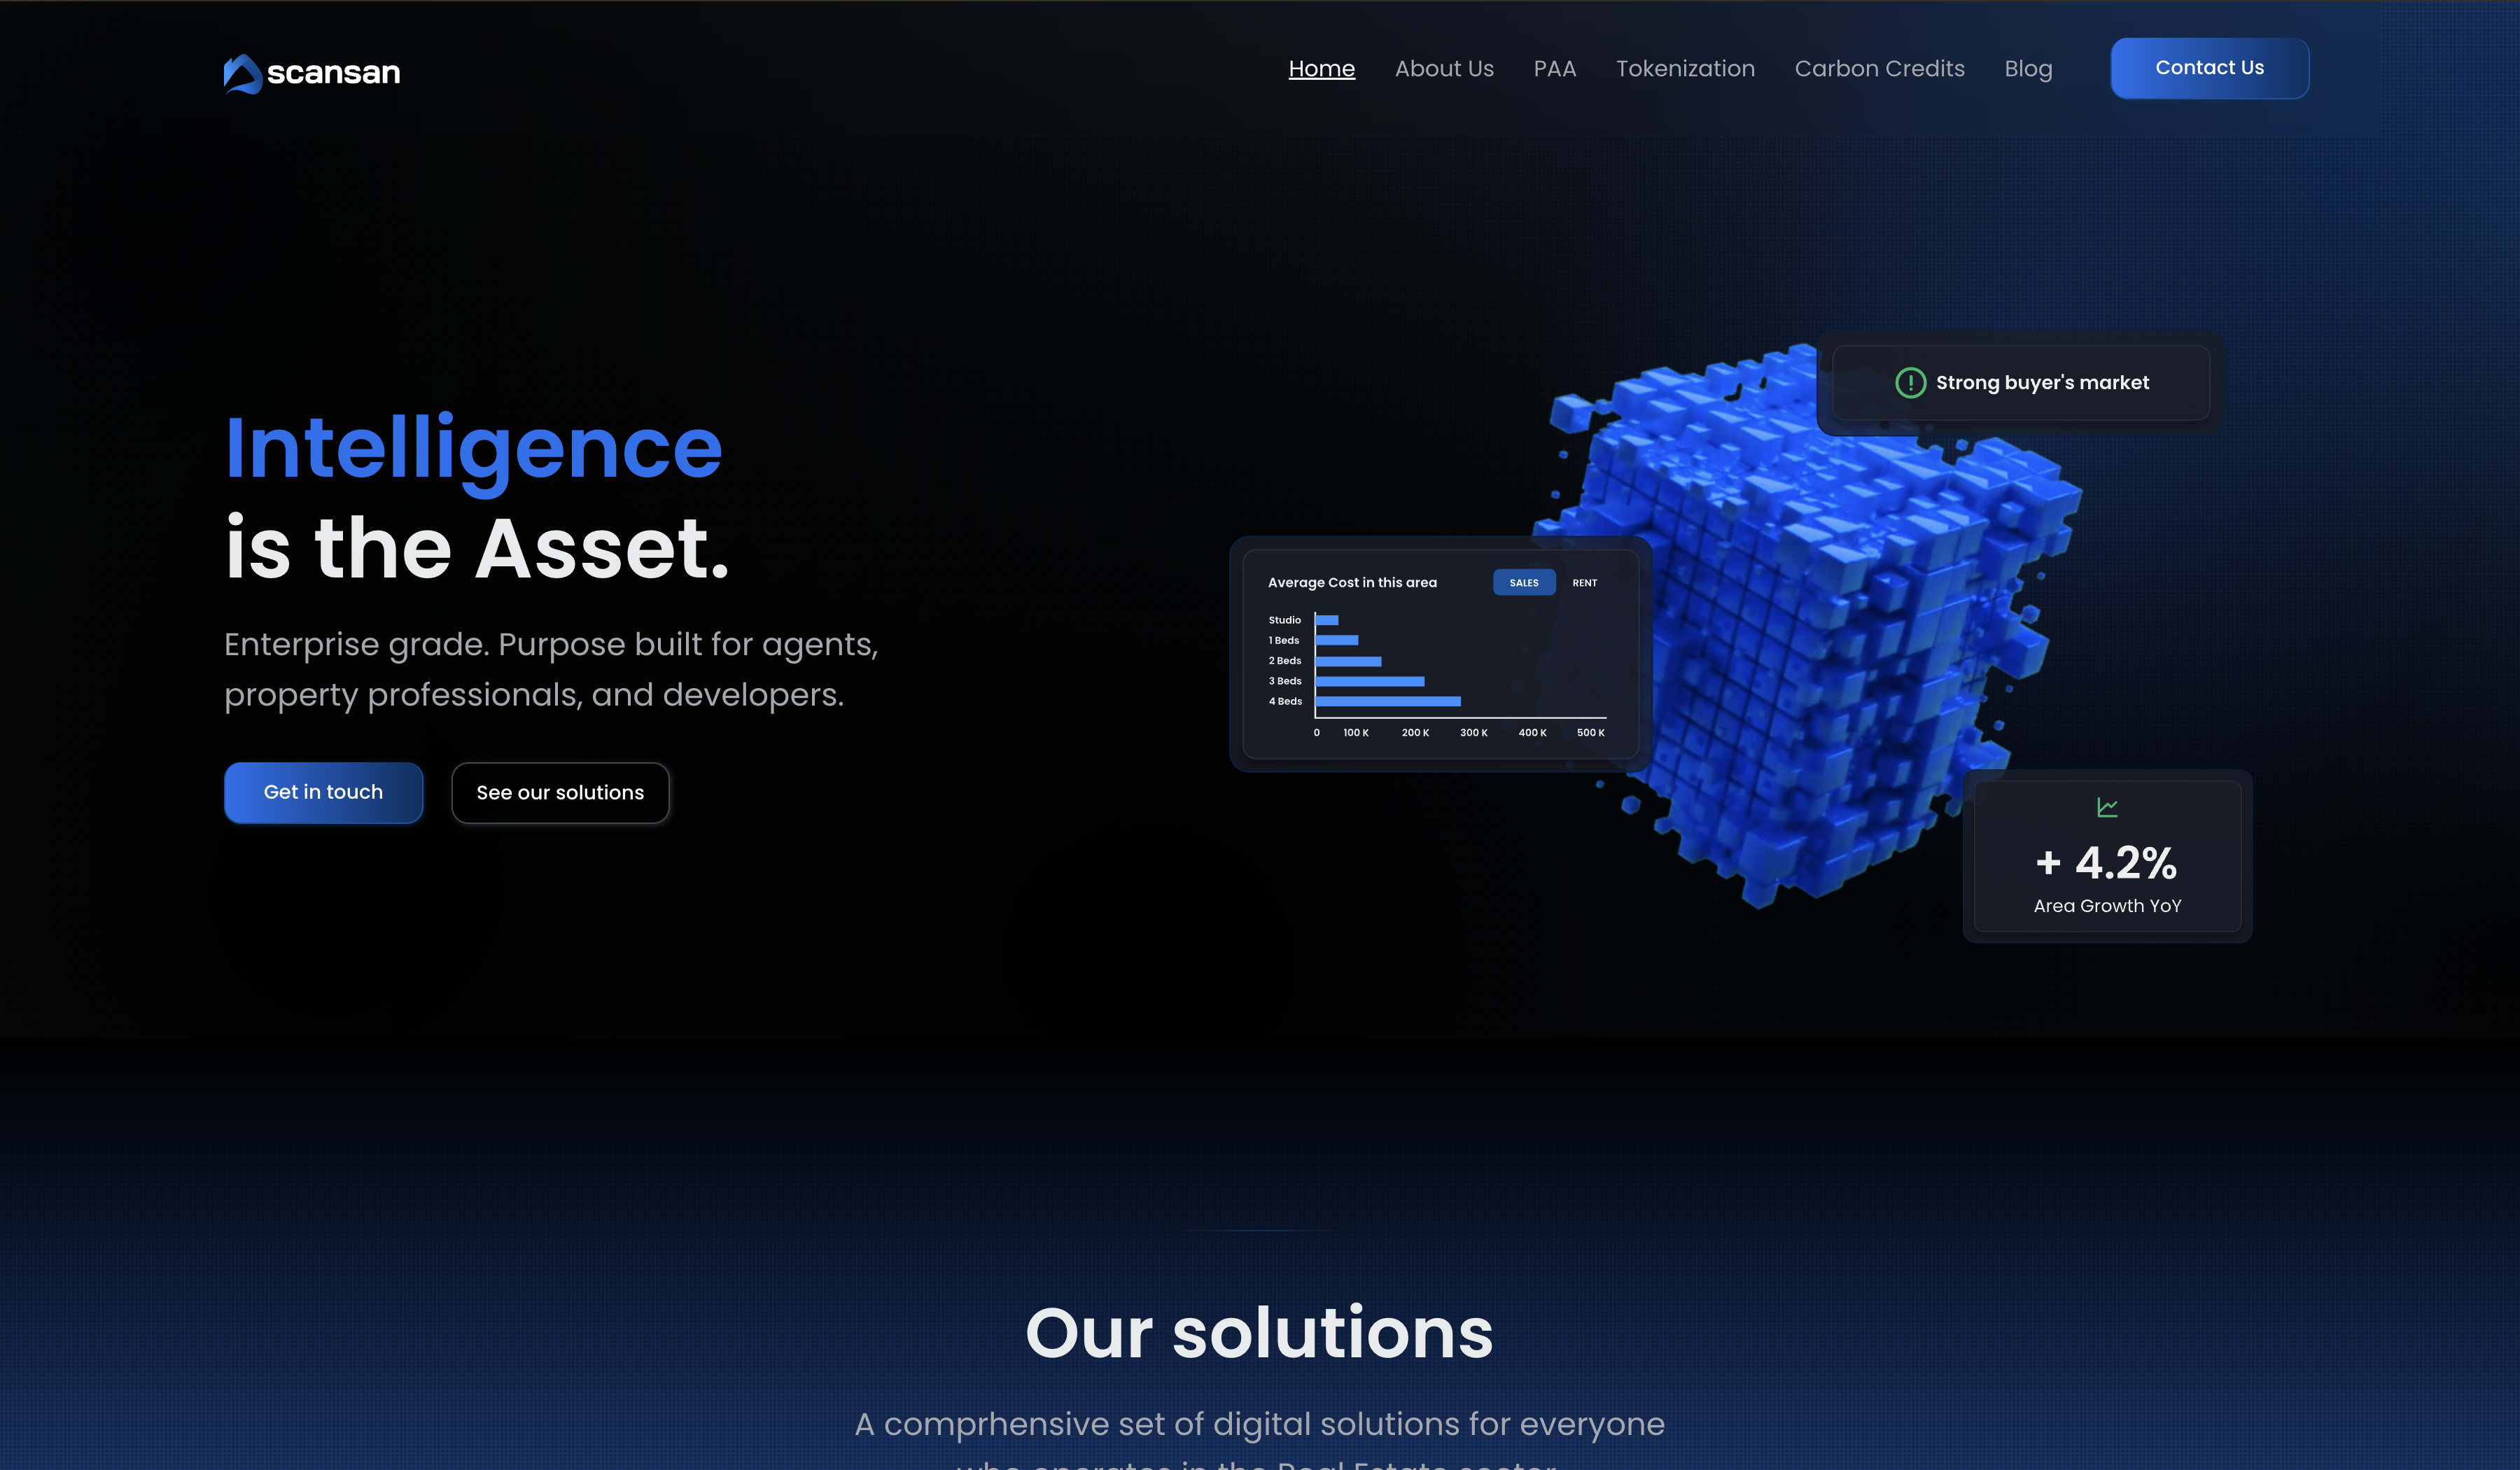
Property Analysis Assistant
A comprehensive property analysis platform for UK investors
- Property
- Enterprise platform build
- Croft Group
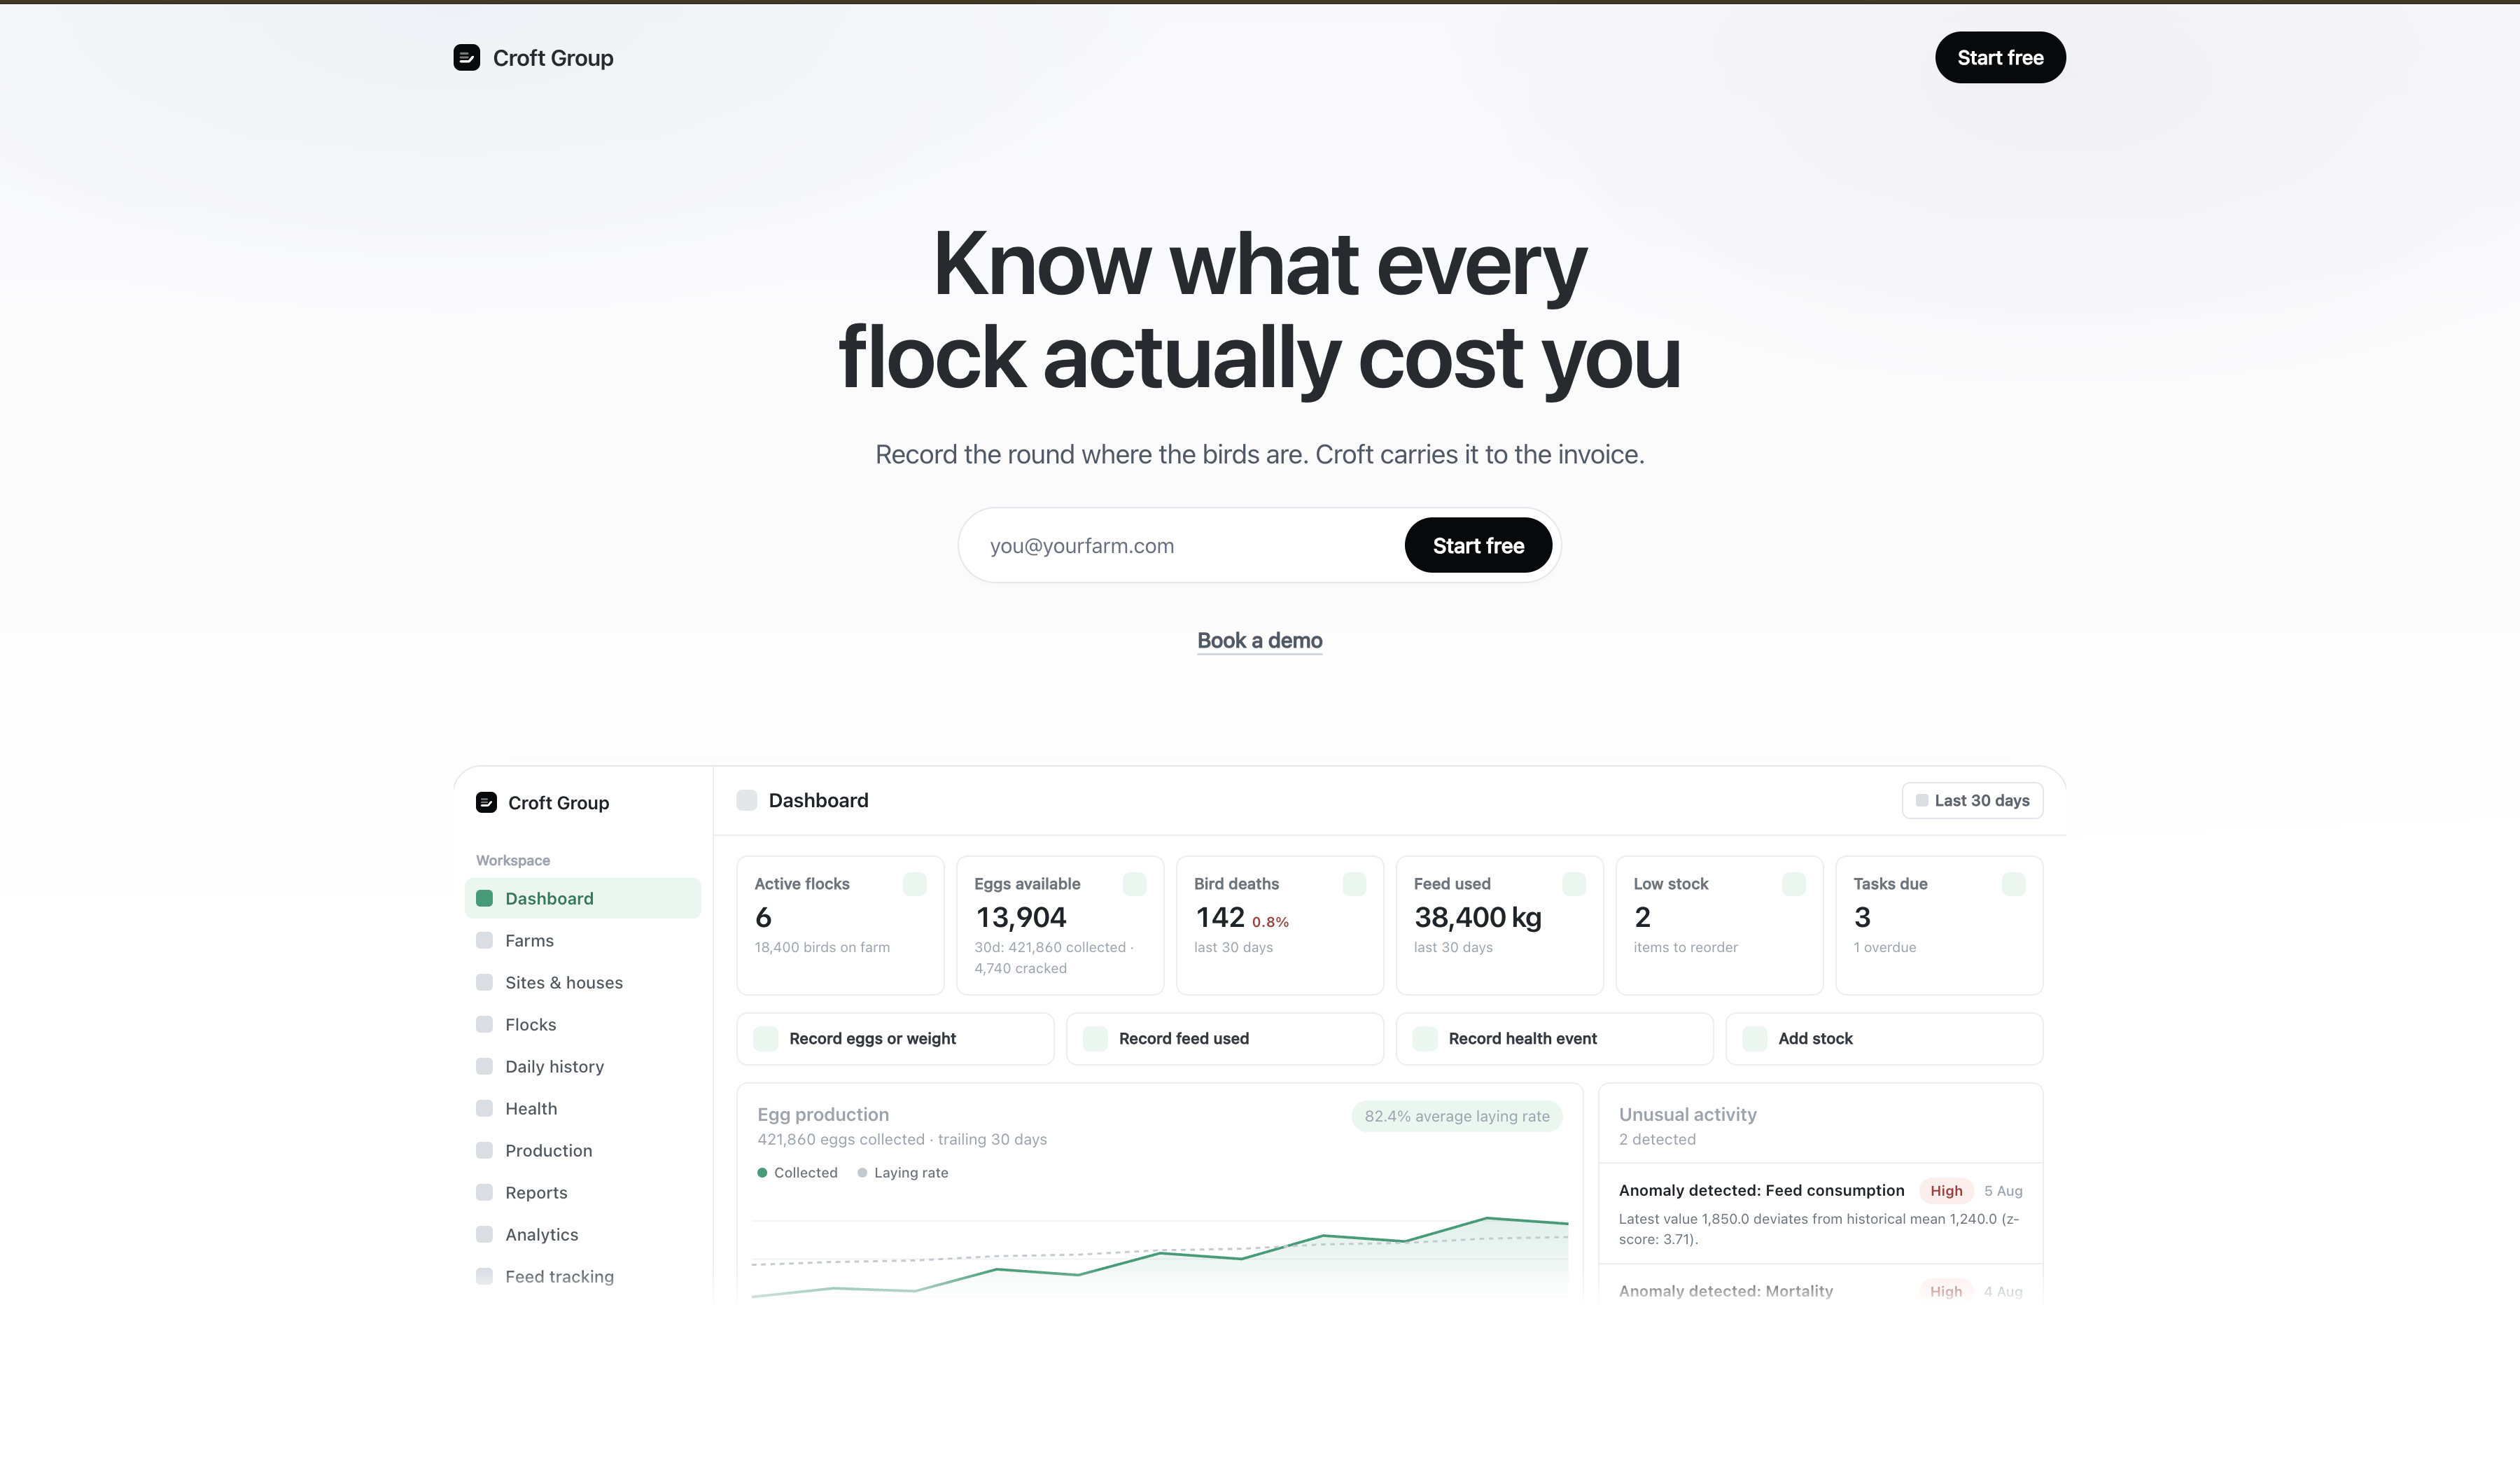
Farm Management Platform
An enterprise management platform for poultry farm operations
- Agriculture
- Full-Stack monorepo build
- swiftwave.vercel.app
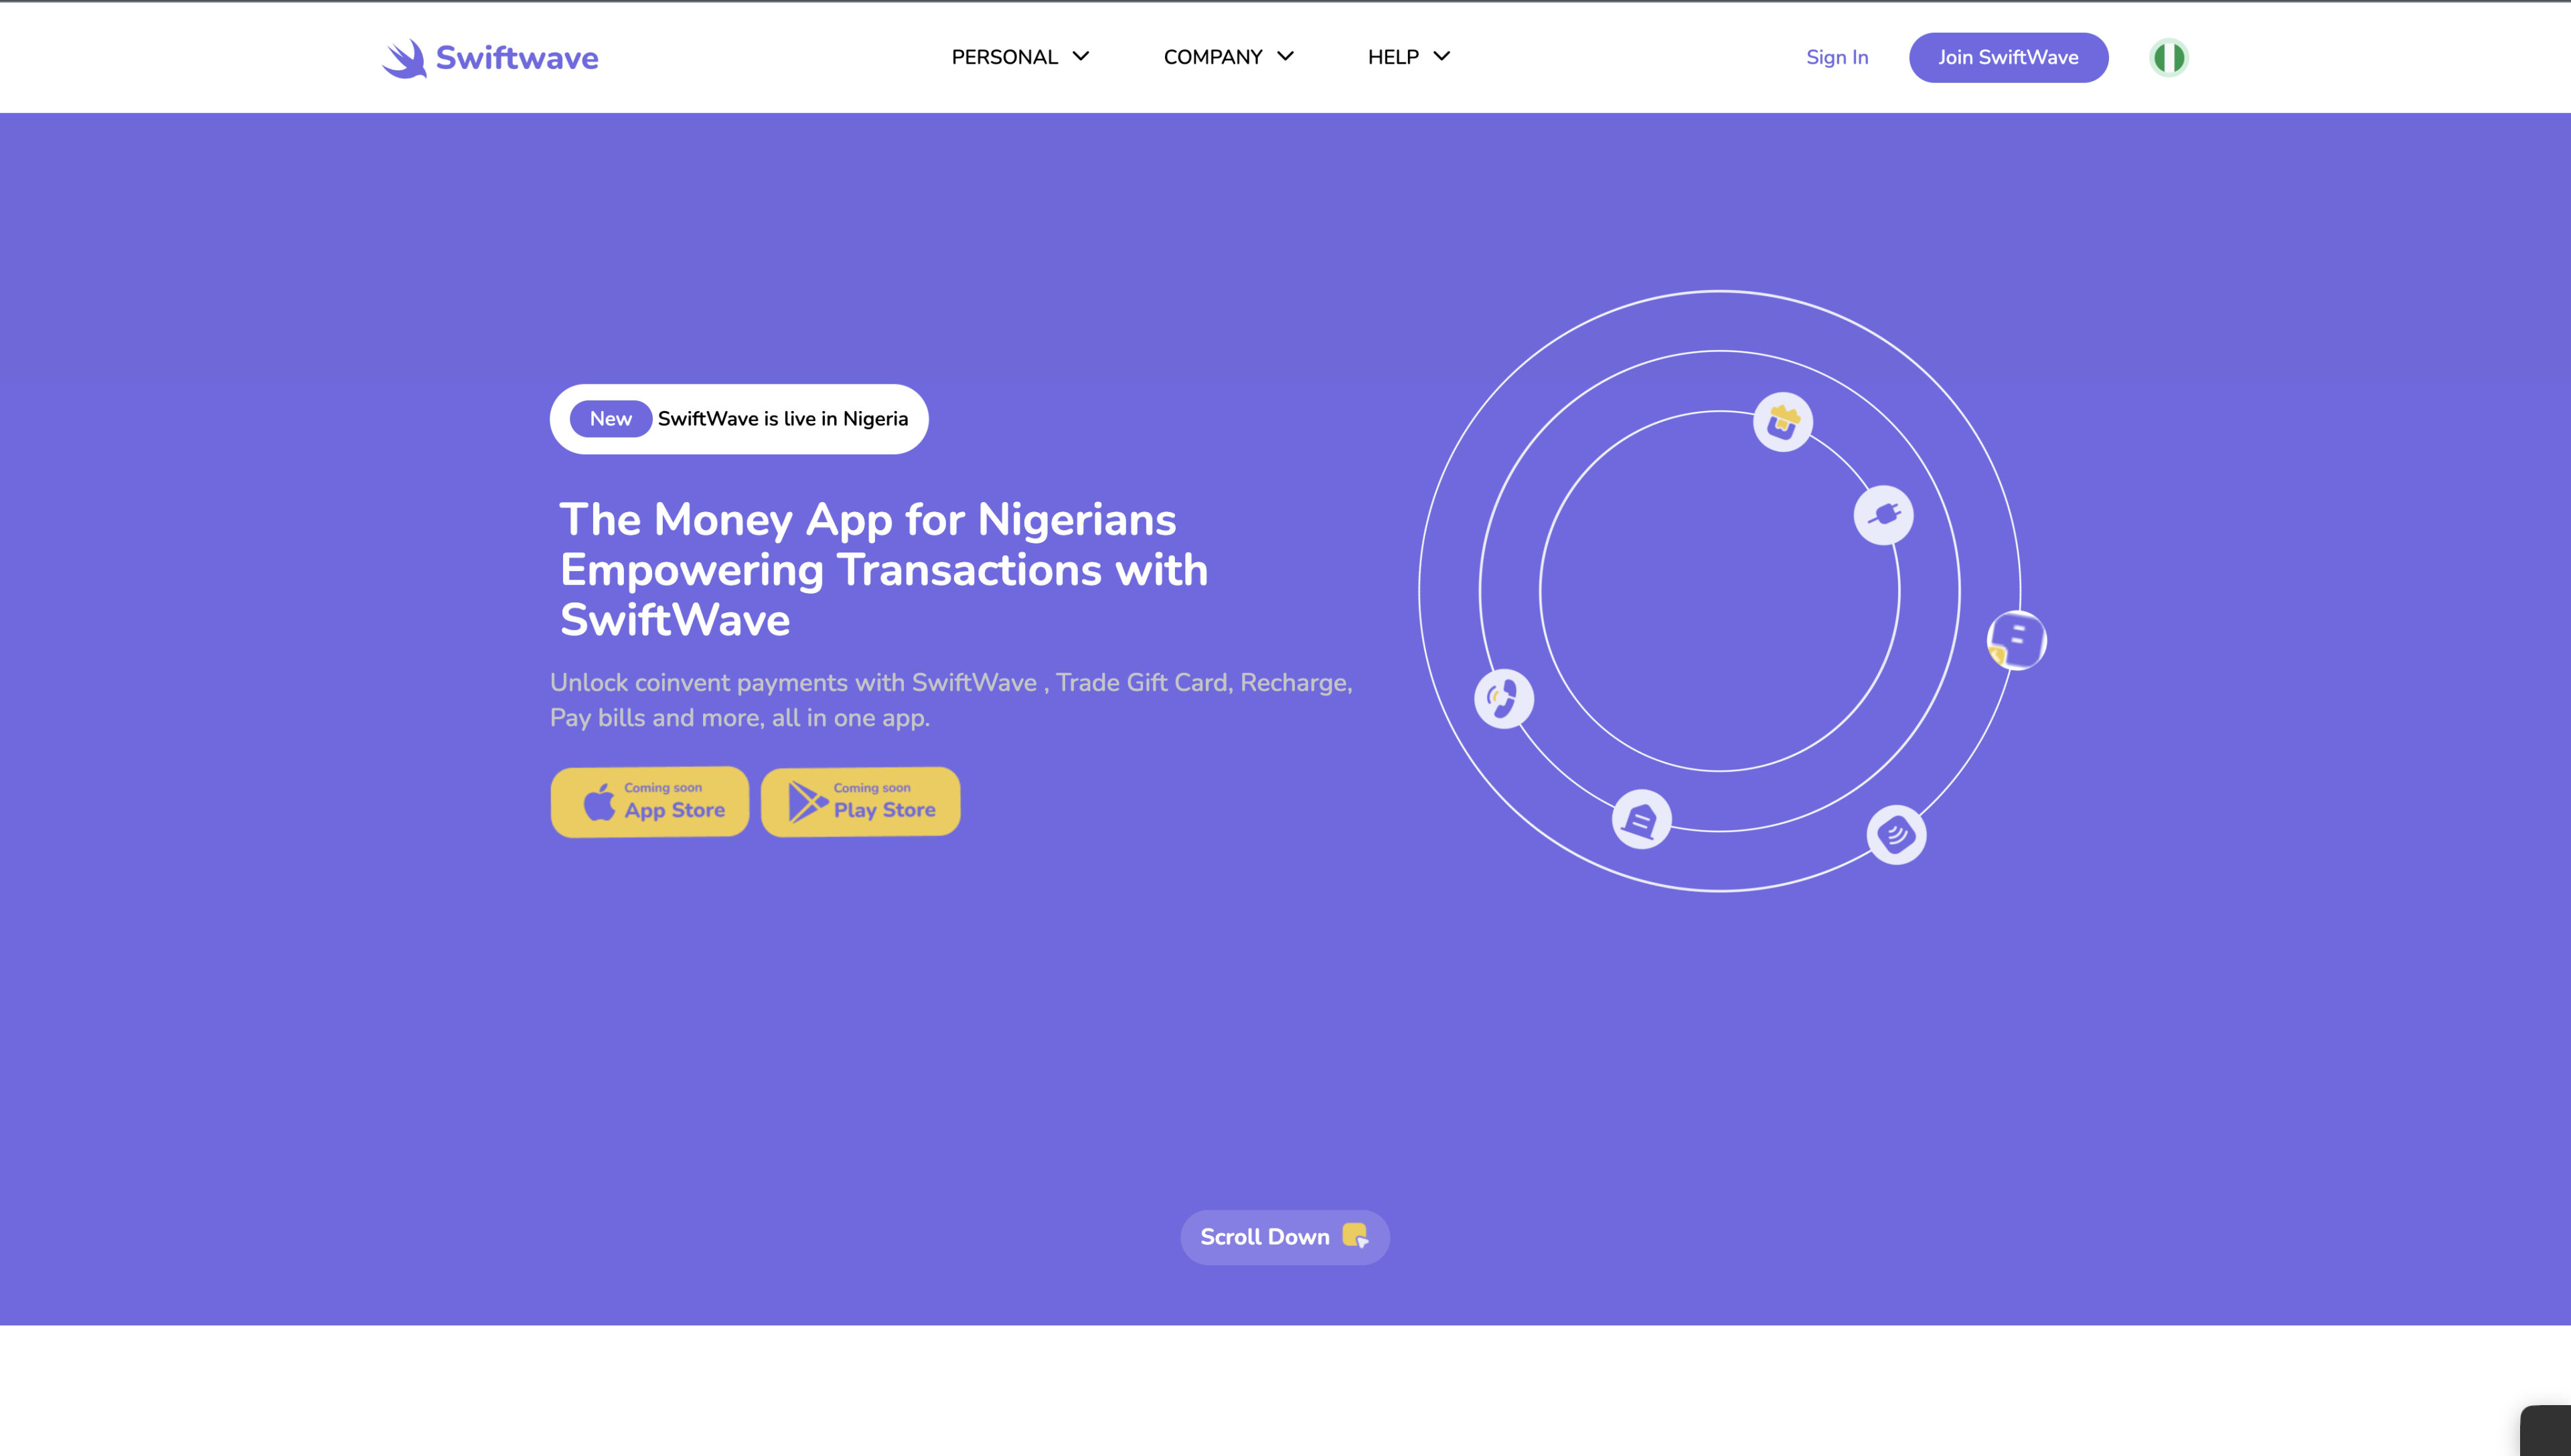
SwiftVista
A scalable utility payments and subscription platform
- Fintech
- Full-stack platform build
Questions
Can you work with spreadsheets?
Yes. A project can begin with spreadsheets and progress to controlled imports, a database, automated processing or a dashboard where appropriate.
Do you build reporting dashboards?
Yes. Dashboards are designed around defined measures, source data and the decisions each user needs to make.
Can you combine data from several systems?
Yes. We can design integrations and processing pipelines that validate and combine data from agreed systems and files.
More in Digital Solutions
What do you want to build?
Our project assistant asks a few questions and writes a brief. A person at DelacoTech replies with scope, price and dates.